CLIENT WORK / IPR + INTEGRAL / 2026
How age
shapes work.
How Age Shapes Employee Engagement, Advocacy, and AI Perceptions
I led the design of this digital research brief through Integral, with assistance from Mayra Hernandez, a designer I managed.
Inside the report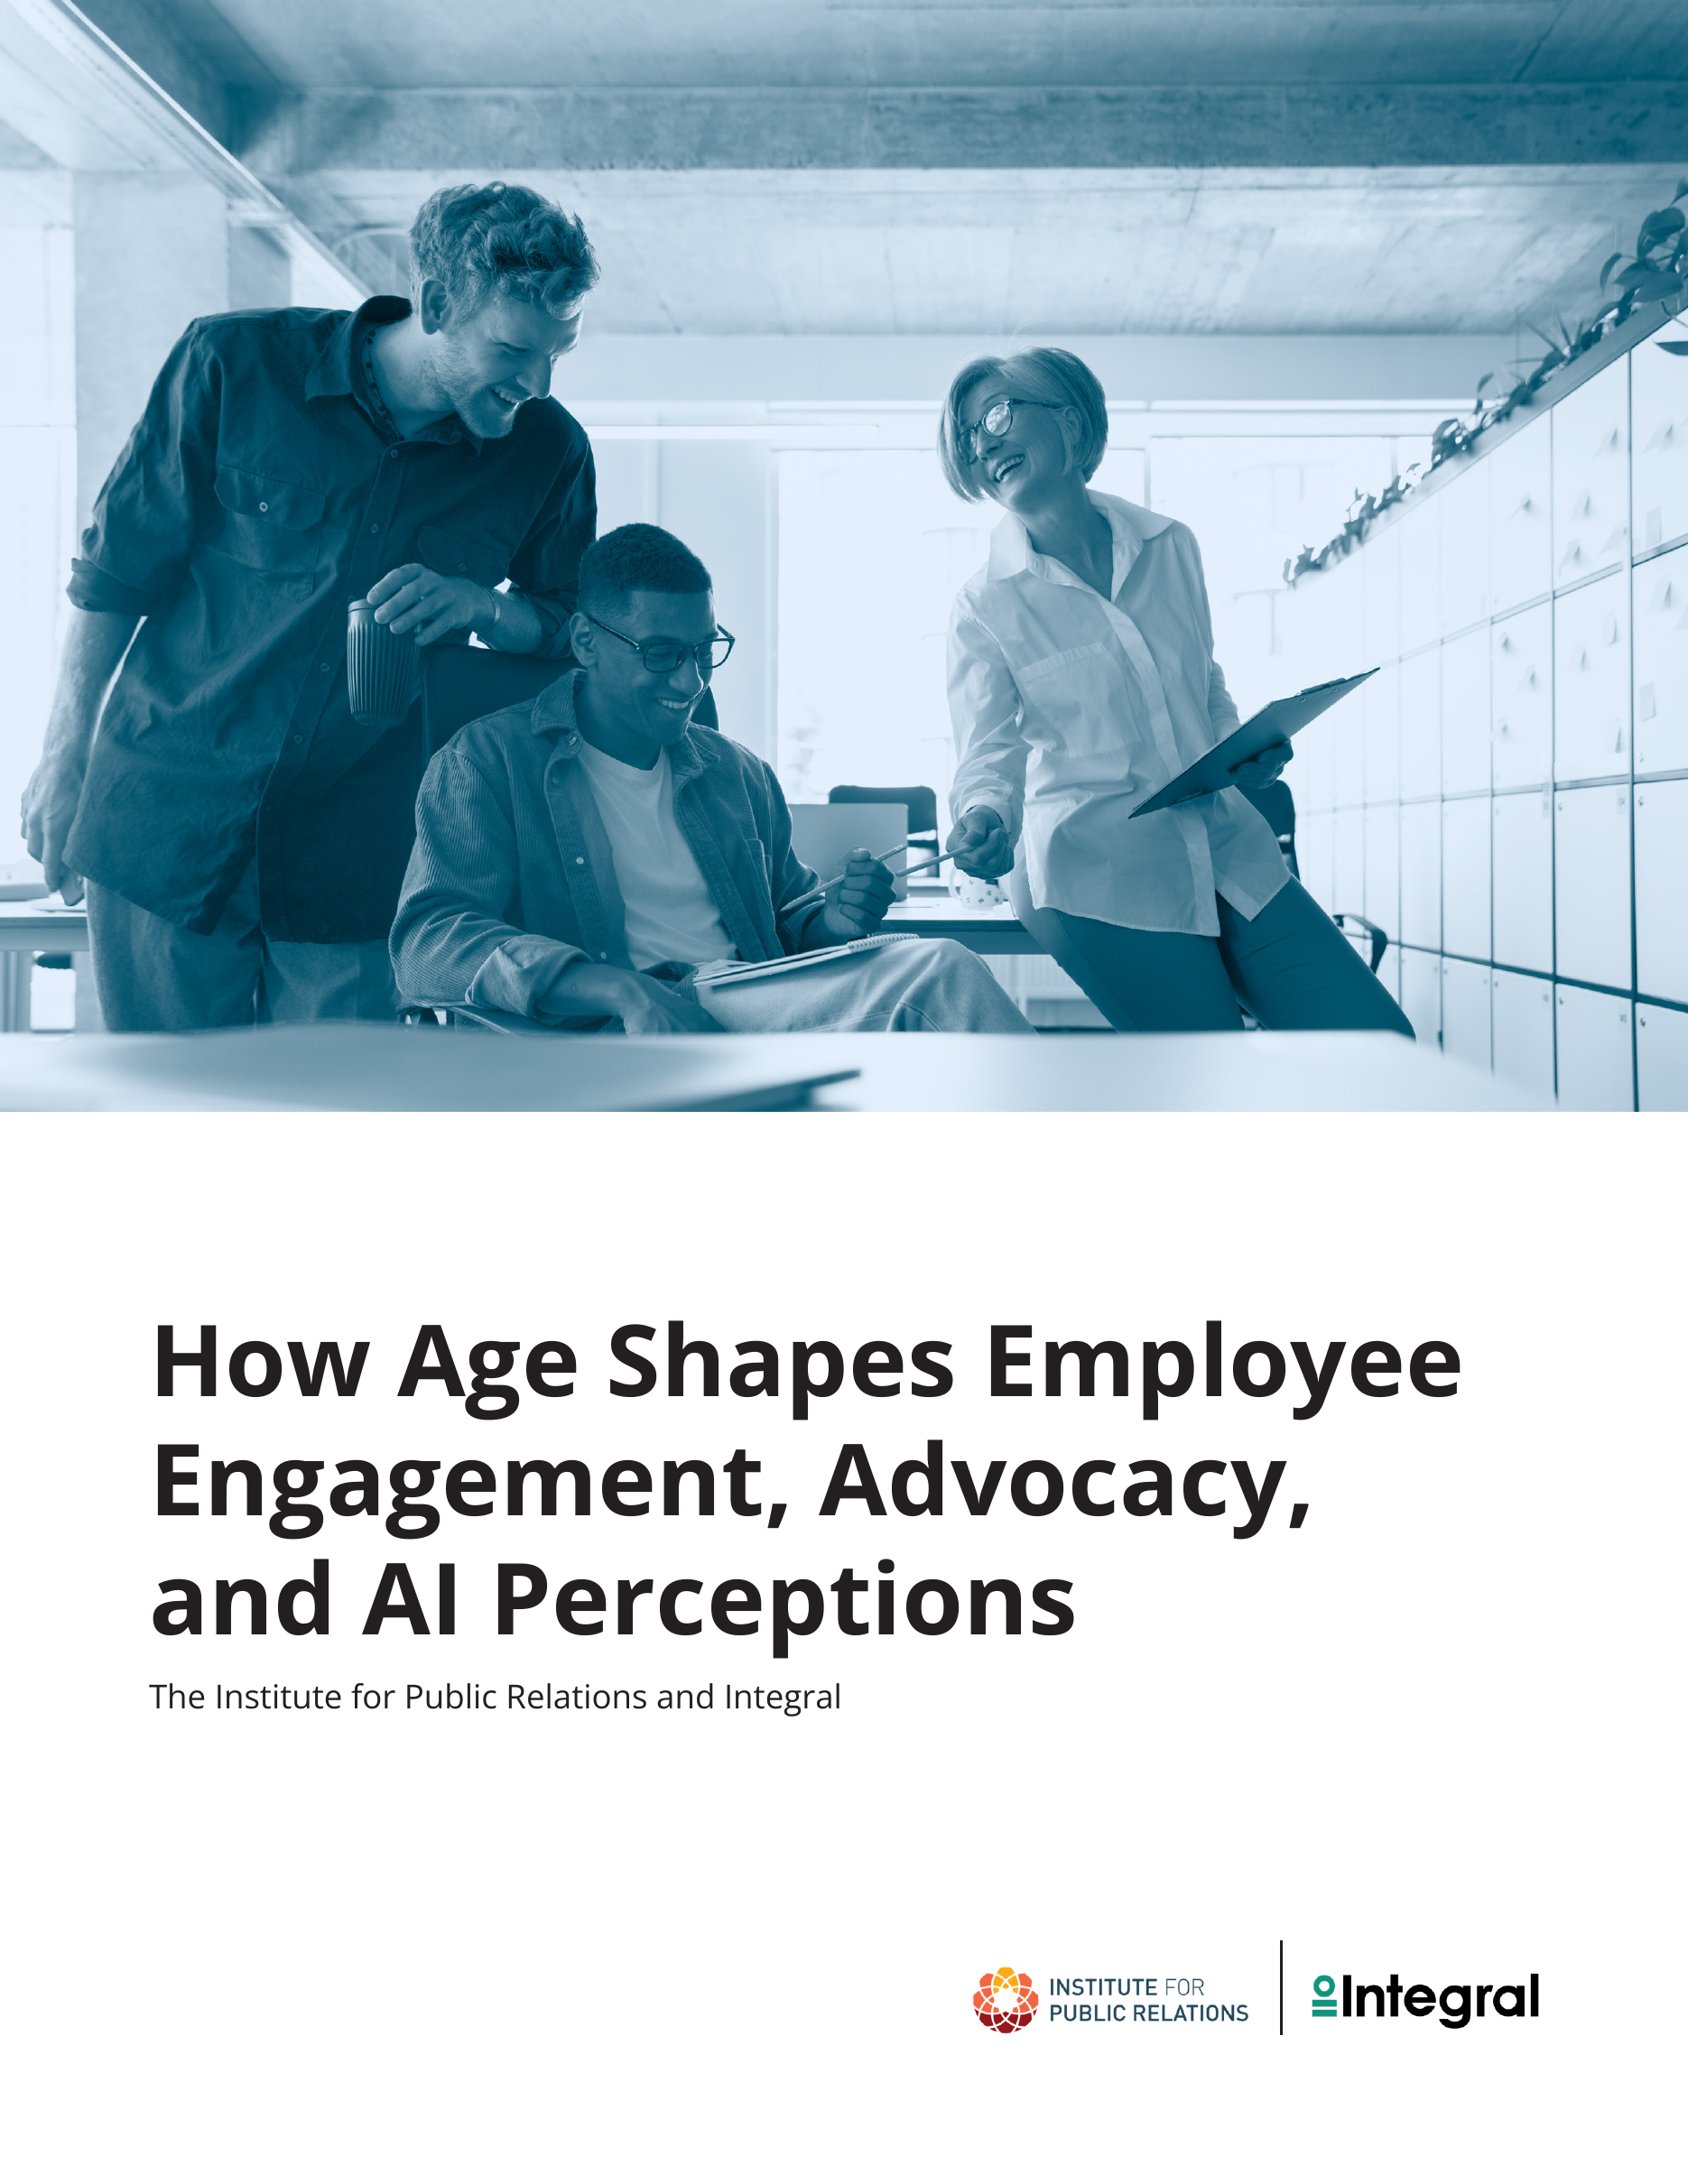
- CLIENT
- Institute for Public Relations
- COMPLETED THROUGH
- Integral
- DESIGN LEAD
- Priscilla Rios
- DESIGN ASSISTANCE
- Mayra HernandezDesigner, managed by me
GIVE THE FINDINGS A READING ORDER
The number needs
its age group.
The brief looks at how employees of different ages experience work. IPR and Integral are the research partners. My role was to organize their findings into a digital report you can follow.
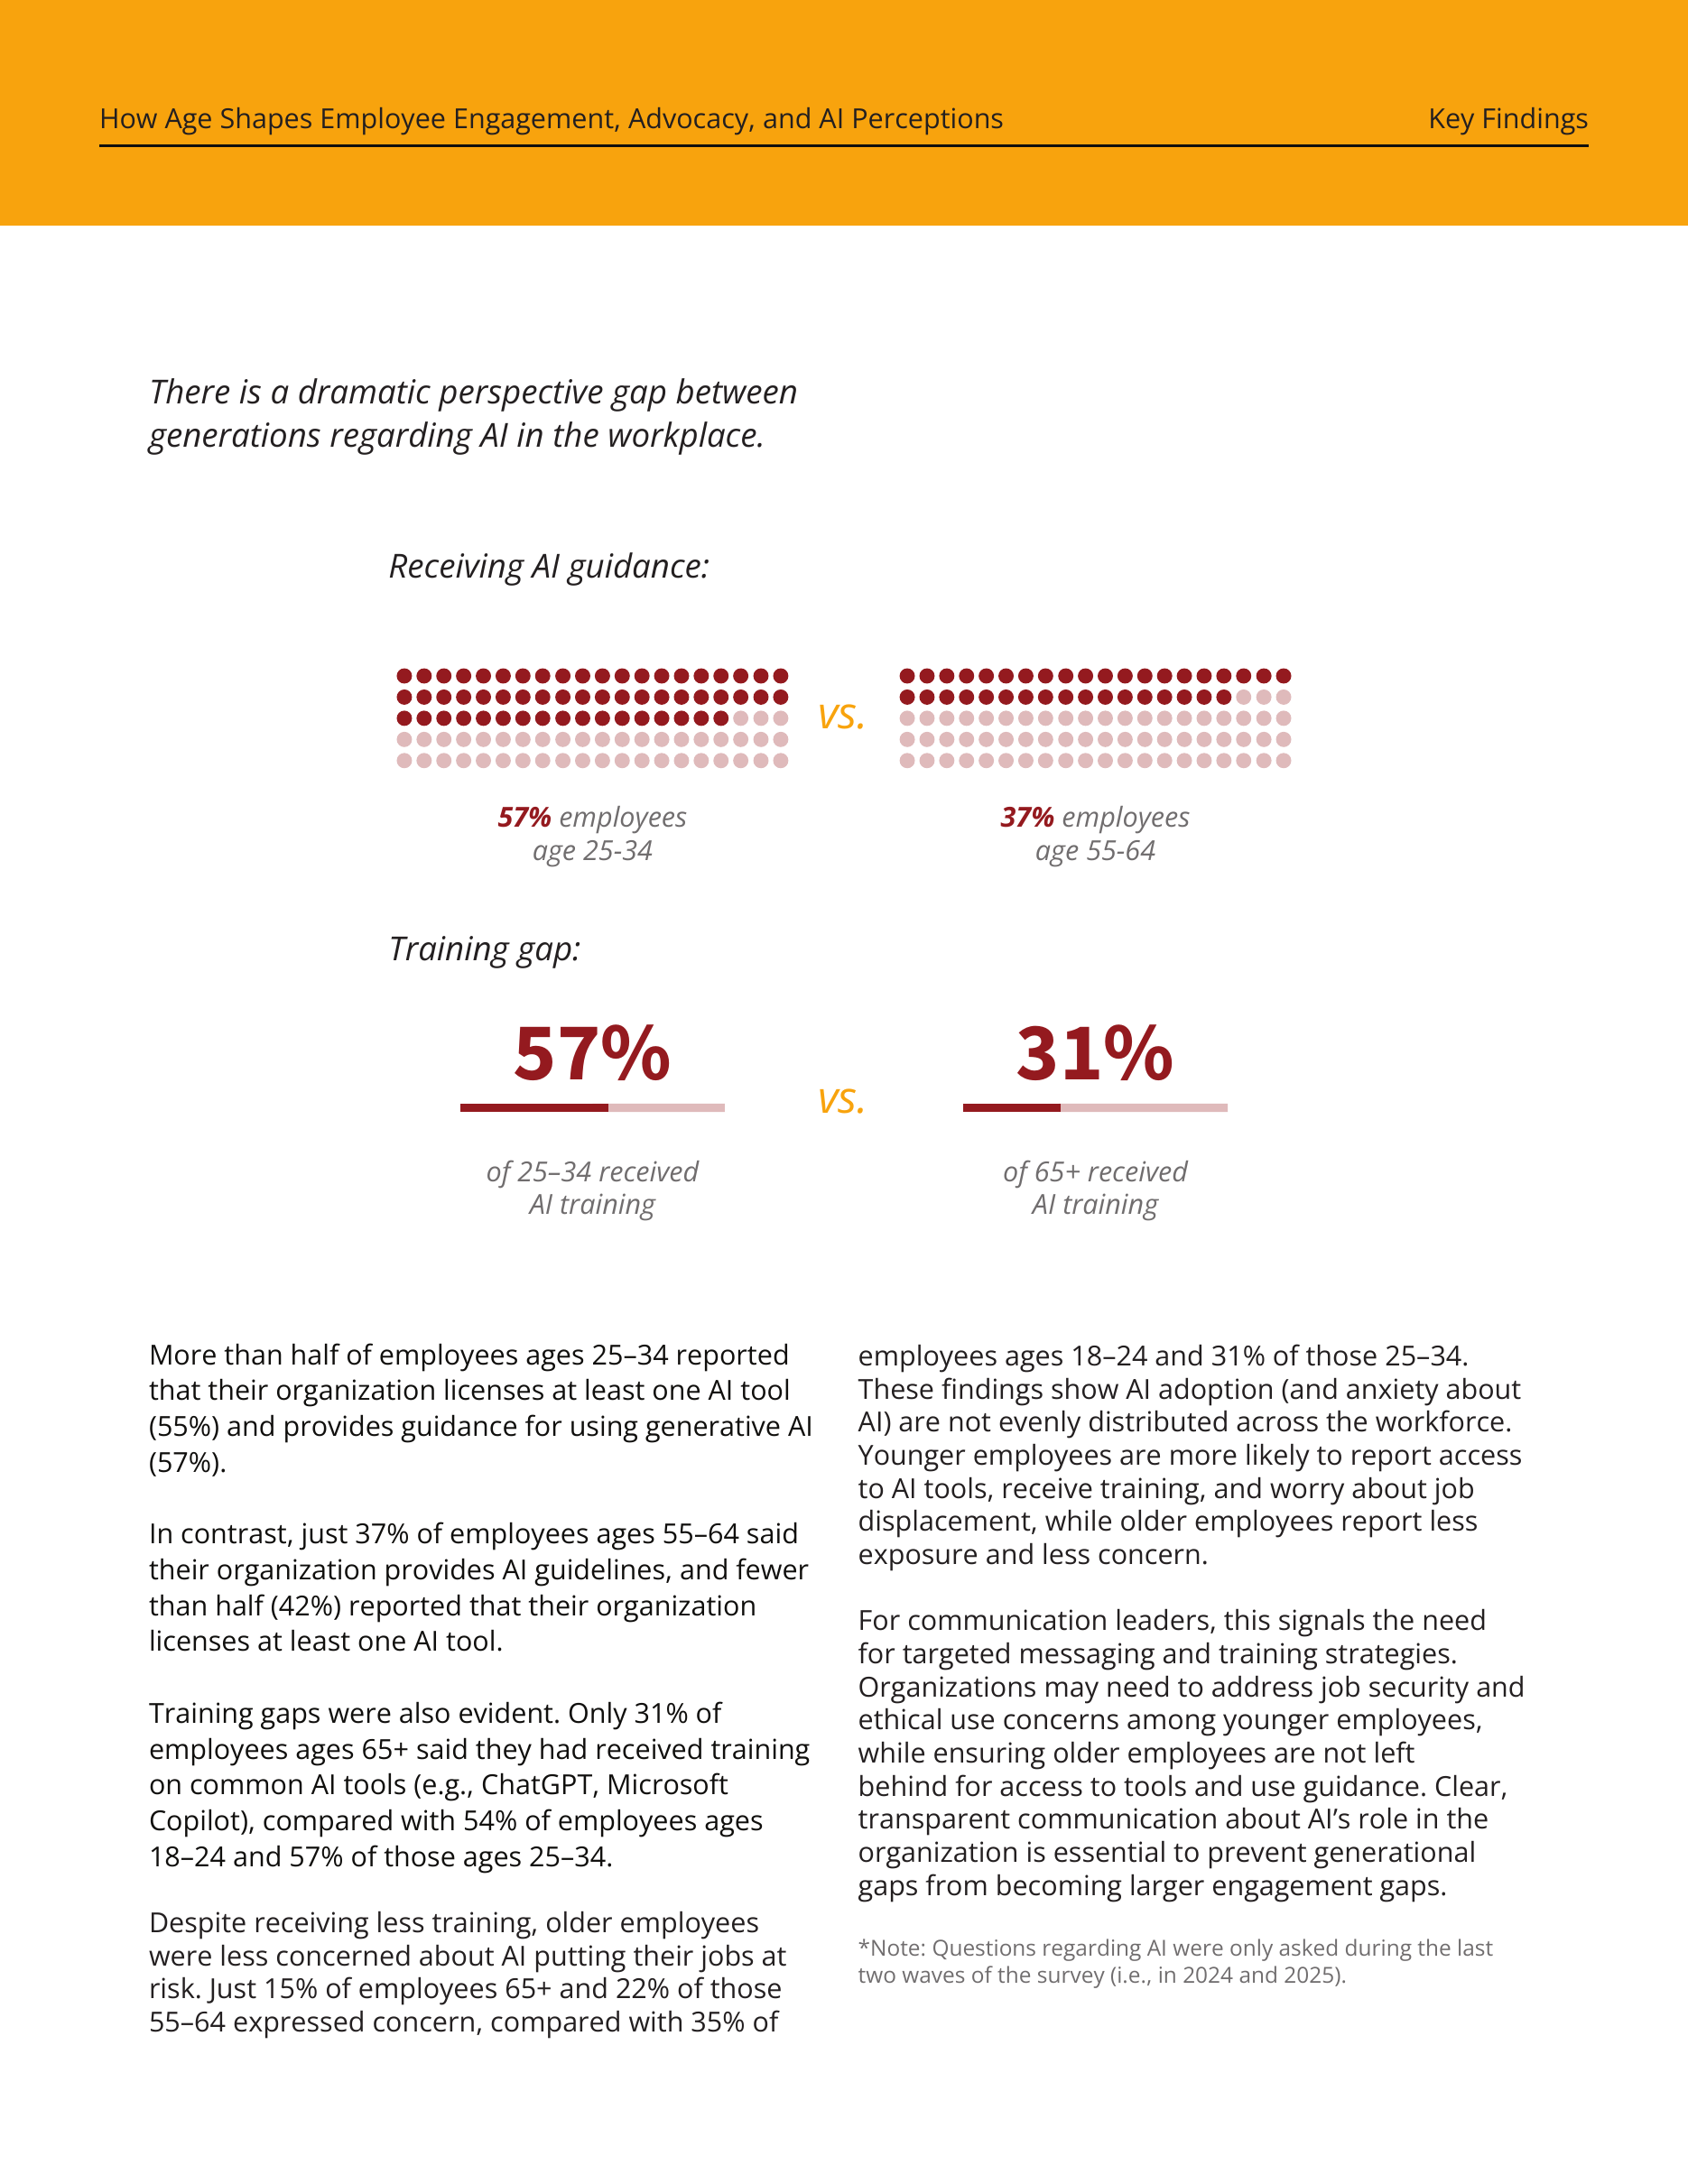
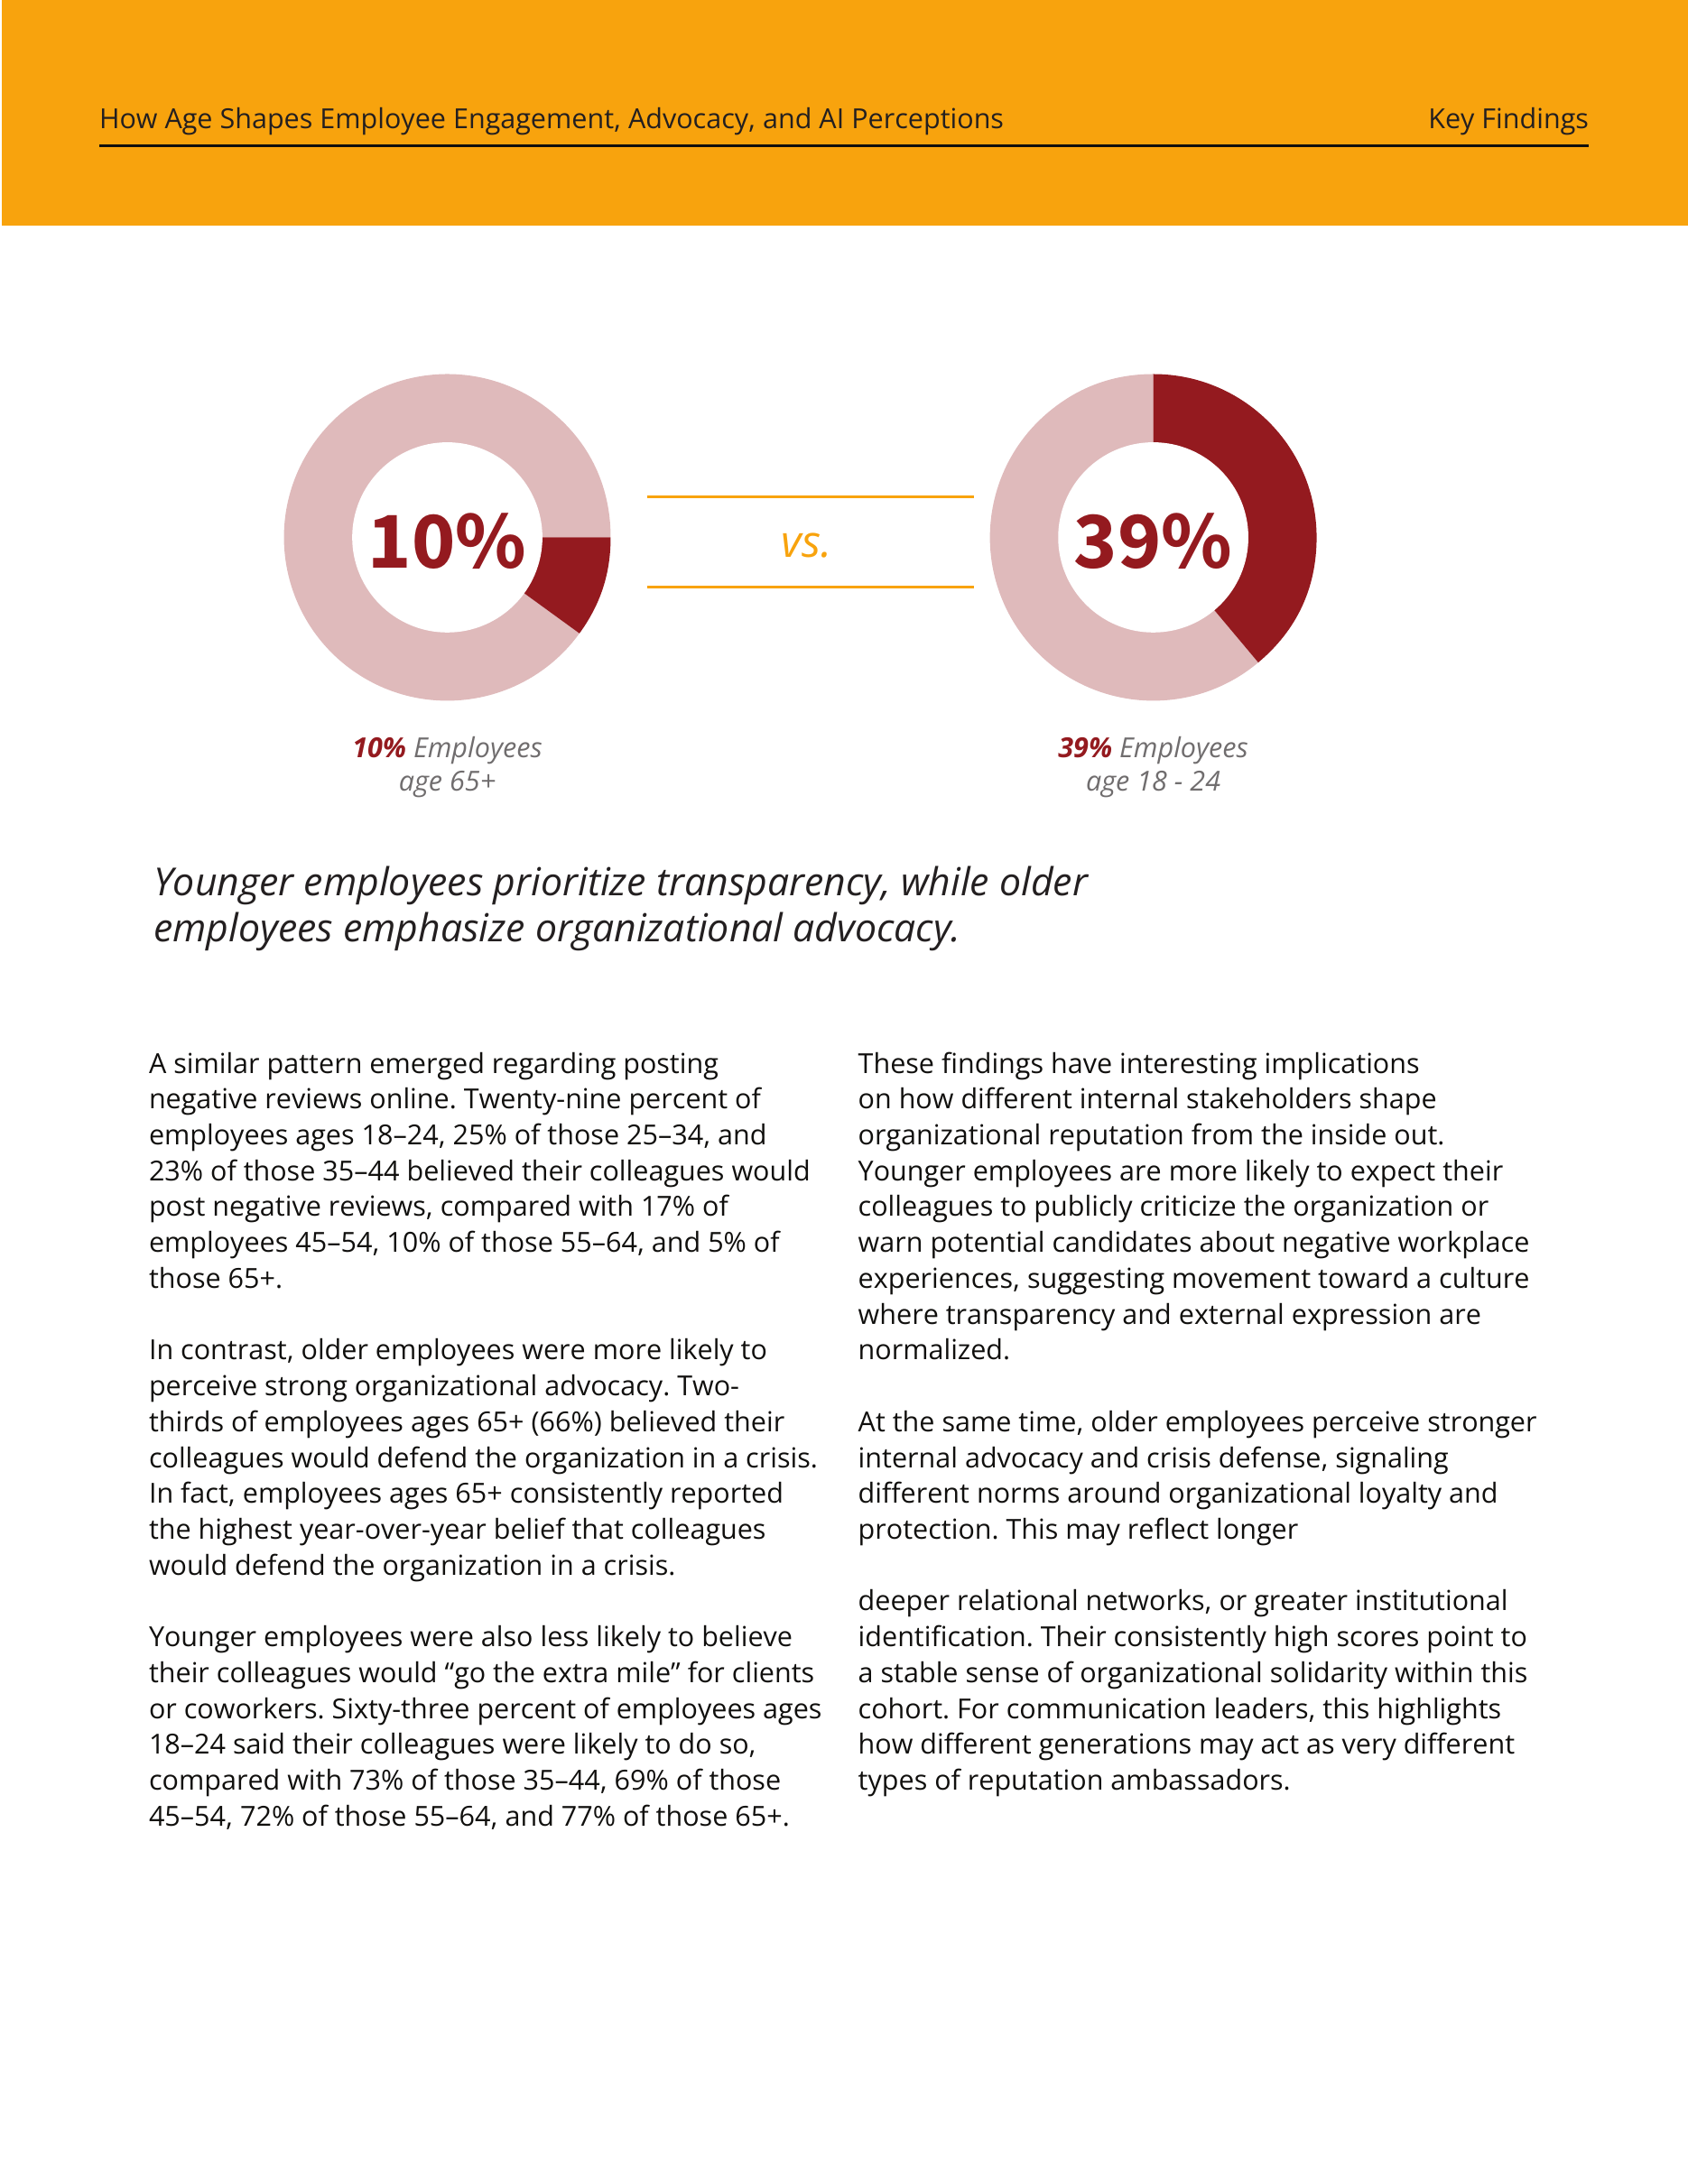
A percentage only makes sense when you know who it describes. I kept the age labels close to the comparisons and gave the figures enough space to register before the longer explanation.
THE DIGITAL PAGE
A grid that
holds the detail.
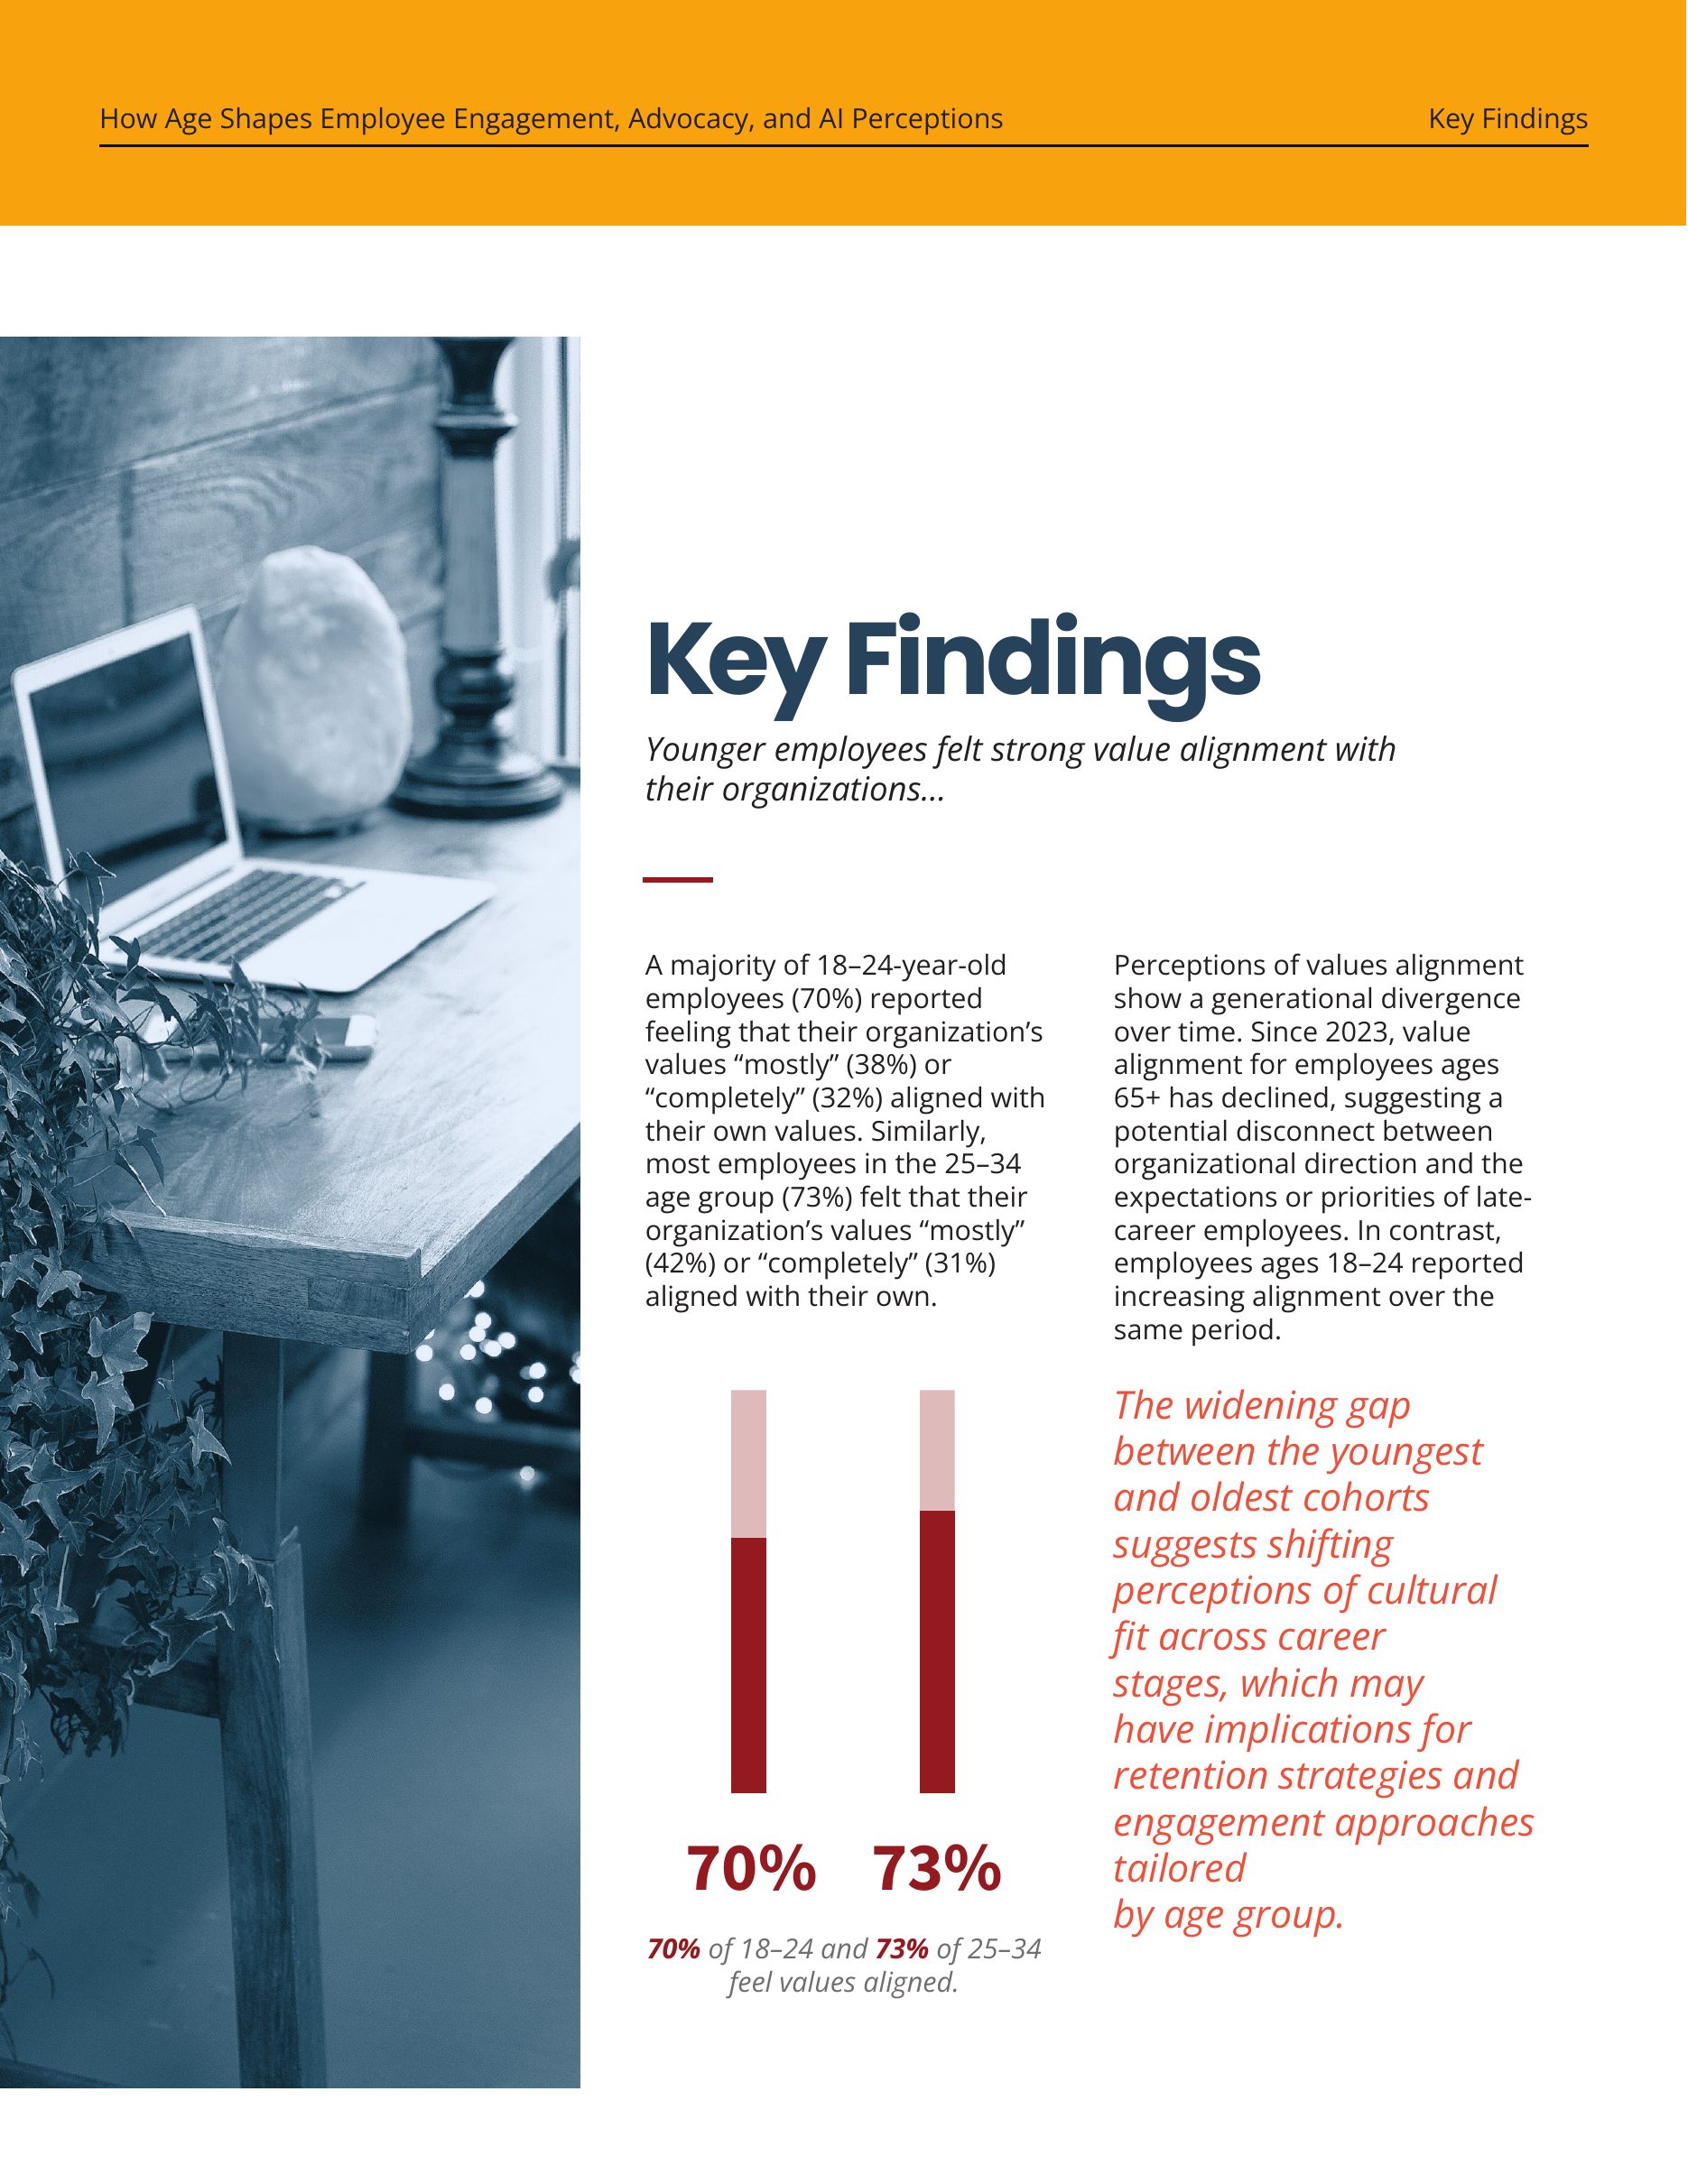
Two columns carry the longer reading. The photograph changes the pace, while the red comparison and coral quotation give the findings a clear place on the page.
A VISUAL THREAD THROUGH THE REPORT
The people
stay in view.
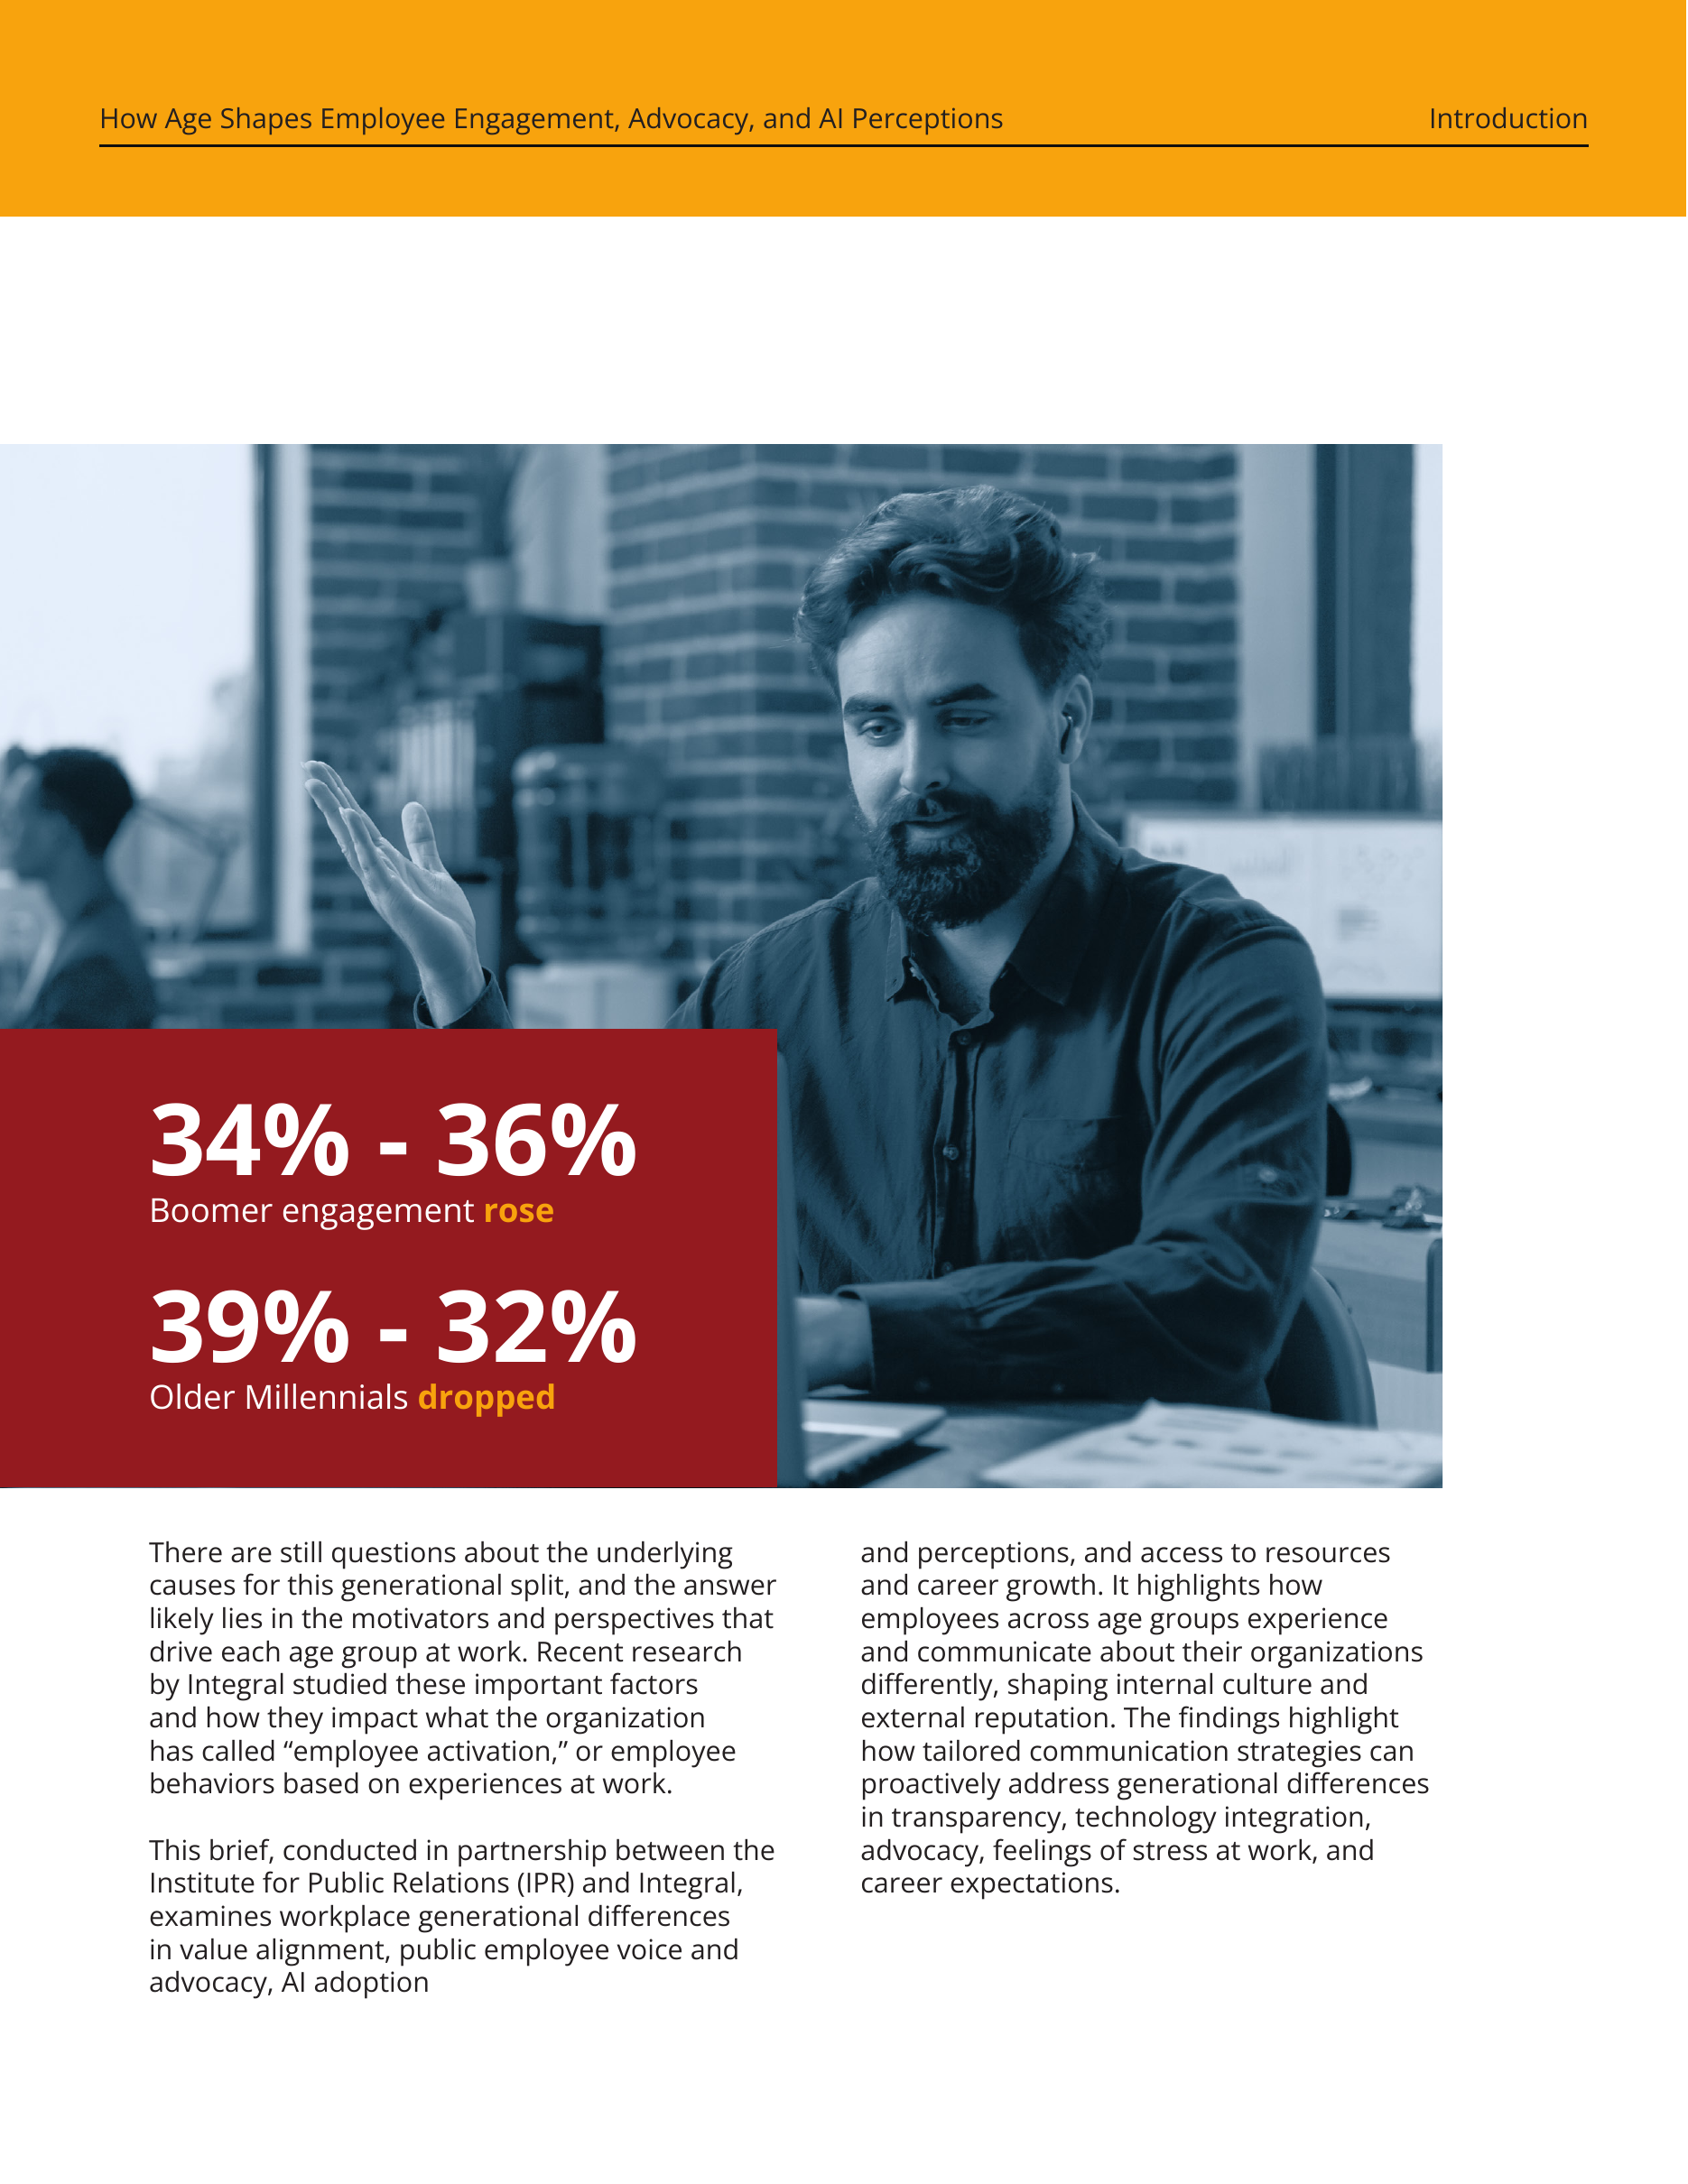
The blue treatment keeps the workplace photographs consistent as the compositions change. Figures use a deeper red, and yellow running headers keep the section label visible above the reading.
COLOR FROM THE ORIGINAL REPORT
THE COMPARISON SYSTEM
Keep the groups
in view.
Dot grids and larger percentages share the same role: they let you compare each age group before reading the detail. The group labels stay attached to the figures.
THE PUBLISHED WORK
A selected look at the ten-page digital research brief. Original design led by me through Integral, with Mayra’s assistance.